UK House Price Index Scotland: September 2023

September 2023 Stats Overview
On average, properties in Scotland were sold for a price of £195,000.
The yearly shift in property prices in Scotland increased by 2.5%.
The property value in Scotland went down by 0.2% on a monthly basis.
Scotland's index score (based on January 2015 data that was set at 100) was 144.8.
The current monthly estimates are not yet final and may change as more information is added to the index. You should check out the revision policies for more information.
UK HPI's Upcoming Release
On December 20, 2023, at 9:30 AM, the UK HPI report for October 2023 will be made available. For additional details, refer to the release schedule.
The estimated average prices of houses in Scotland went up by around 2.5% between September 2022 and September 2023, which is better than the revised estimation of 1.9% increase between August 2022 and August 2023. Additionally, this growth rate in Scotland is higher than the UK's average annual inflation rate for house prices that was roughly -0.1% in the same period.
The average house prices in Scotland went down by 0.2% between August 2023 and September 2023 without factoring in seasonal changes. This is better compared to last year's decrease of 0.7% during the same period. However, when the seasonal changes were considered, the average house prices in Scotland went up by 0.2% between August and September 2023.
When we compare the temporary estimation of the UK HPI volume in July 2022 to that of July 2023, we observe a reduction in the number of transactions by 13.9% in Scotland and 21.9% across the UK.
The biggest increase in property value in Scotland was seen in detached houses, which rose by 5.2% in the year up to September 2023, leading the way amongst all types of properties. These homes now have an average price of £358,000. Terraced houses saw the smallest rise in value, increasing by just 0.8% over the same period to an average price of £164,000.
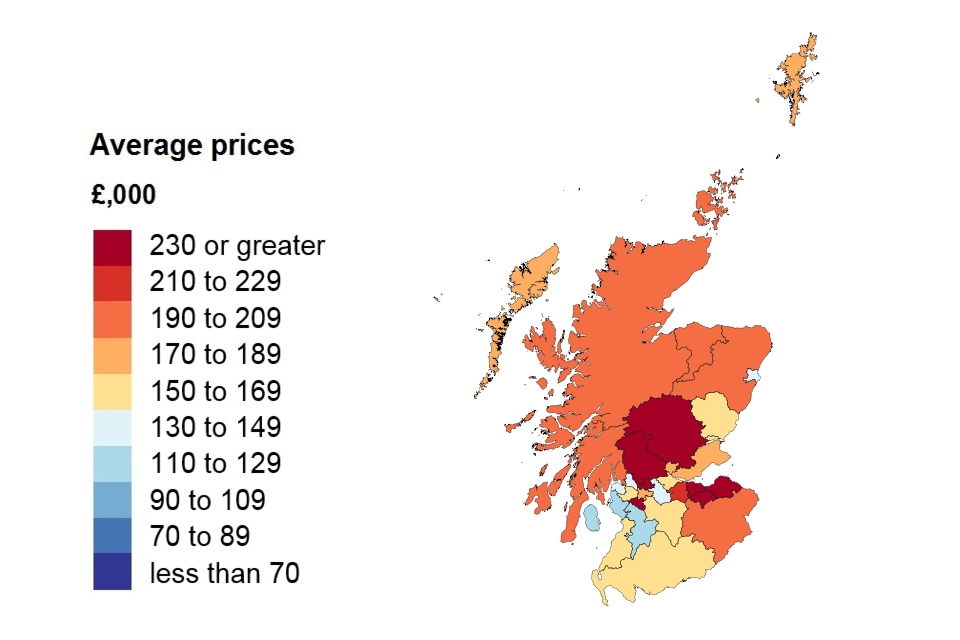
East Lothian saw the biggest rise in average house prices in the UK, with a whopping 15.2% increase to a total of £348,000 in the year leading up to September 2023. On the other hand, North Ayrshire experienced a notable drop in average house prices, with a decrease of 4.0% to £127,000 during the same period.
Similar to other signs in the housing industry, which regularly change every month, it's crucial to not give excessive significance to the house price statistics of a single month.
Yearly Price Fluctuation
In Scotland, the average costs rose by 2.5% during the period from September 2022 to September 2023. This marked an increase from the previous year where the average prices went up by 1.9% from August 2022 to August 2023.
In certain areas like Orkney Islands, Na h-Eileanan Siar and Shetland Islands, the sales transactions are quite low. This can cause the series to fluctuate frequently.
Although we attempt to factor in this unpredictability, fluctuations in prices at the community level can be swayed by the quantity and class of real estate that has been sold during a specific timeframe.
When looking at areas with a limited amount of sales deals, it's better to examine their extended patterns rather than concentrating solely on short-term changes.
By September 2023, East Lothian took the crown for being the priciest place to buy a property, with an average cost of £348,000. On the other hand, North Ayrshire clinched the title of the most budget-friendly area with the average cost of £127,000.
"Property Type Prices: 3.2 Avg. Change"
The duration for processing and announcing property sales can fluctuate and usually lasts from 14 days to 60 days or even more in some cases. The latest two months' numerical data don't have enough credibility to be stated in the report. However, the record of transactions in the present months will rise gradually when supplementary registered data are added to the index.
You can access information on sales volume based on whether the property is brand new or already existed and whether it was bought with cash or a mortgage in the downloadable data tables. Transactions that involve a new registration, like for new buildings, take longer to process since they're more complicated. To learn more about this, you can read about the changes made to the UK HPI data.
Sales Volume Analyzed By Area
The section in the blog has been altered to make it more understandable. We have left out the 'Difference' column from this table because the most recent month's information is still being collected.
Please keep in mind that the upcoming month of July 2023 will reflect a higher number of property transactions in the UK HPI index. This is due to additional transactions being included. For further details, kindly refer to our Revisions Policy.
When we look at the early UK HPI volume calculations for July 2022 and compare them to the early UK HPI volume calculations for July 2023, we can see that there has been a decrease of 13.9% in the number of transactions in Scotland.
The HM Revenue & Customs has published data on UK Property Transactions. This information has varying coverage, but it is more comprehensive for the specific period. The data shows that there was a 14.6% decline in HMRC volume transactions in Scotland over the 12 months leading up to July 2023, without taking into account seasonal variations.
Deals that require a new registration, like building a new property, are more intricate and take longer to finalize. Therefore, it may take more time for them to be listed in the land registry. The figures for new property transactions in the last two months are too unreliable to determine how many were new constructions and how many were resold properties. Consequently, the report excludes these transactions.
Attention: After the October 2017 update, our estimation process for determining our preliminary estimate has been modified. Discover additional details and how this revised methodology affects the generation of the UK HPI.
Get Data Access
You can choose to obtain the information in CSV format by downloading the files, or you can make use of our UK HPI tool to gain access to it.
Check for any changes made to data that was published before in the downloadable data section, or get detailed information regarding revisions by reading the guidance available in our About the UK HPI section.
"UK Home Price Index Overview"
The Office for National Statistics and Land & Property Services Northern Ireland computes the UK House Price Index (UK HPI). Learn more about the approach utilized in generating the UK HPI.
Information concerning the UK House Price Index is furnished by a number of different sources, including HM Land Registry, Registers of Scotland, The Land & Property Services/Northern Ireland Statistics & Research Agency, and the Valuation Office Agency.
Discover further information on the Index of House Prices in the United Kingdom.


